Description
Transcription
Page header
- Running head: “Results of the Field Survey in Combination with LiDAR Laser Scanning in the Medni Rid Area”
- Page number (upper right): 309
Figure frame — component labels (clockwise from upper left as printed)
- LiDAR remote sensing (upper left) — label above a greyscale shaded-relief / hillshade thumbnail showing a textured terrain surface with ridges, hollows, and fine linear/pitted relief.
- airborne remote sensing (upper right) — label above a colour oblique/vertical aerial photograph thumbnail of vegetated hilly terrain with visible clearings, tracks, and a pale linear feature / open strip.
- map interpretation (middle right) — label above a colour historical/cartographic map thumbnail (aged paper tones: yellows, greens, red boundary lines, blue hydrography; appears to be a multi-sheet or atlas-style regional map with red rectangular highlights/boxes on parts of the sheet stack).
- satellite remote sensing (bottom centre) — label above a greyscale satellite image thumbnail of textured ground; small “USGS” logo badge at lower-right of that thumbnail.
- material analysis (middle left) — label above a colour laboratory photograph thumbnail of a multi-channel pipette / liquid-handling instrument over a clear multi-well plate (analytical chemistry / lab bench setup); partial instrument branding text visible on equipment (including a small “røm”[?] / lab-device logo mark — partially legible).
- (traditional) field work (centre) — label in parentheses above a colour field photograph: four people standing on a grassy track/open ground with scrub and bare trees in leaf-off or early-season condition; persons wear outdoor clothes; one has a bright yellow backpack; group faces slightly away/side-on as if consulting or looking into the survey area.
Central graphic structure
- Thick light-blue circular arrow ring surrounding the central field-work photo, composed of two large curved arrow segments suggesting a continuous cycle / feedback loop (clockwise flow): upper arc arrow points rightward soft-curve; lower arc arrow points leftward soft-curve — enclosing “(traditional) field work” as the hub.
Figure caption (directly under the frame)
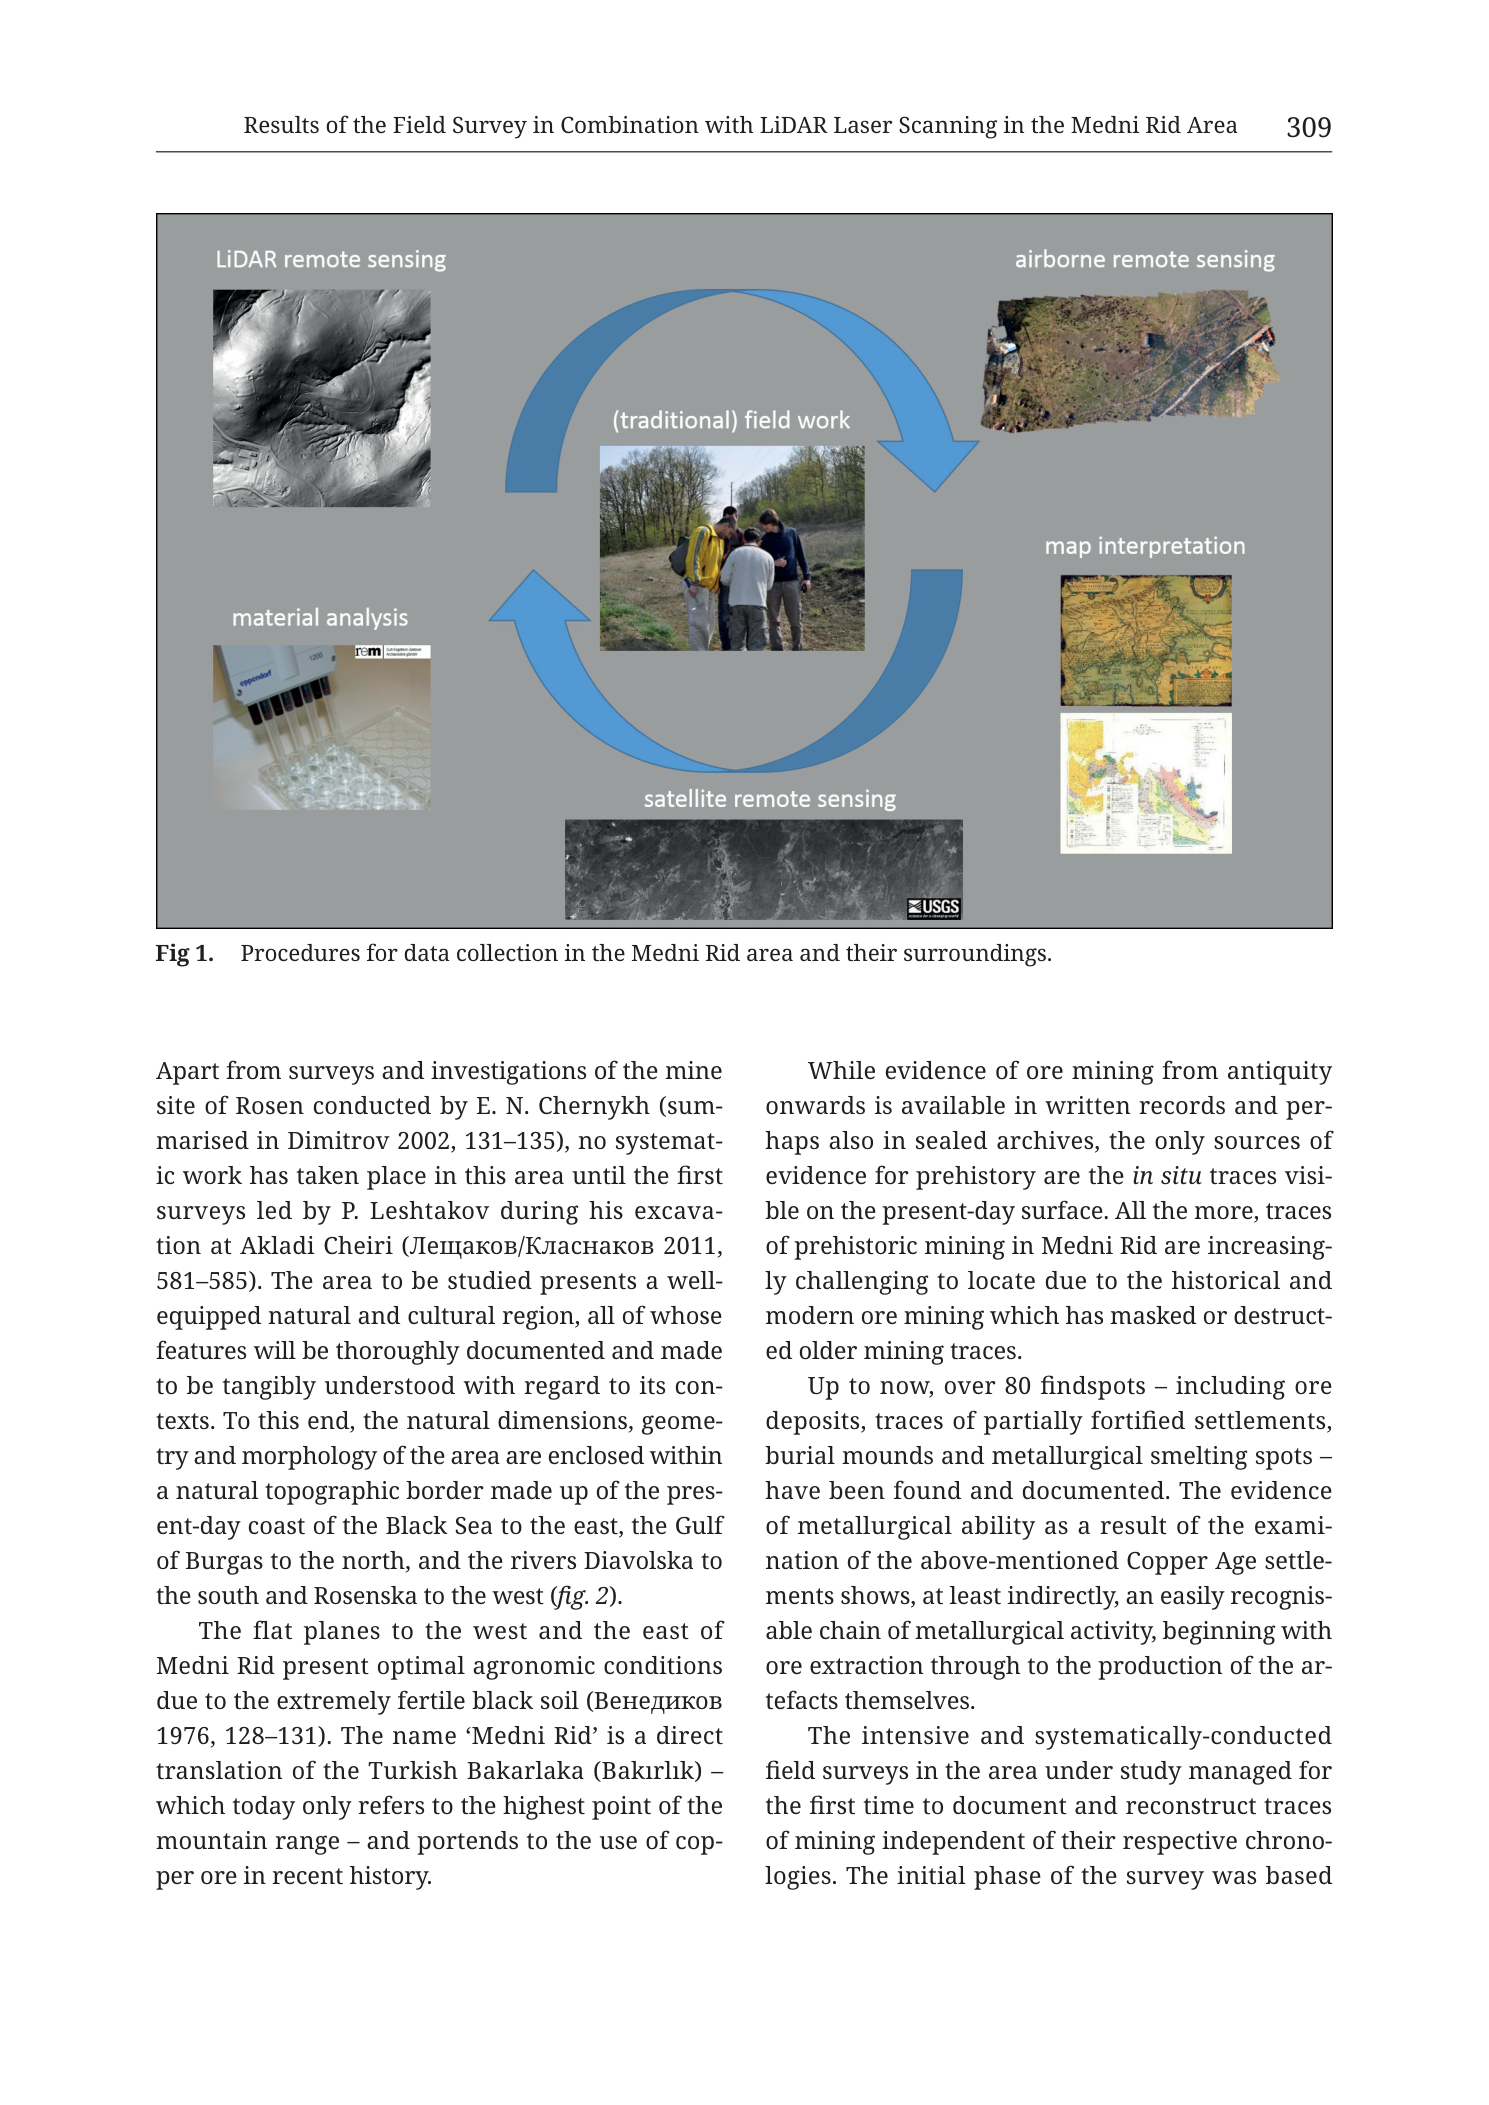
“Fig 1. Procedures for data collection in the Medni Rid area and their surroundings.”
(Note: caption prints “Fig 1.” without a period after “Fig” in the usual “Fig.” style — transcribed as printed.)
Body text on the same page (two columns beneath the figure)
Left column:
“Apart from surveys and investigations of the mine site of Rosen conducted by E. N. Chernykh (summarised in Dimitrov 2002, 131–135), no systematic work has taken place in this area until the first surveys led by P. Leshtakov during his excavation at Akladi Cheiri (Лещаков/Класнаков 2011, 581–585). The area to be studied presents a well-equipped natural and cultural region, all of whose features will be thoroughly documented and made to be tangibly understood with regard to its contexts. To this end, the natural dimensions, geometry and morphology of the area are enclosed within a natural topographic border made up of the present-day coast of the Black Sea to the east, the Gulf of Burgas to the north, and the rivers Diavolska to the south and Rosenska to the west (fig. 2).
The flat planes to the west and the east of Medni Rid present optimal agronomic conditions due to the extremely fertile black soil (Венедиков 1976, 128–131). The name ‘Medni Rid’ is a direct translation of the Turkish Bakarlaka (Bakırlık) – which today only refers to the highest point of the mountain range – and portends to the use of copper ore in recent history.“
Right column:
“While evidence of ore mining from antiquity onwards is available in written records and perhaps also in sealed archives, the only sources of evidence for prehistory are the in situ traces visible on the present-day surface. All the more, traces of prehistoric mining in Medni Rid are increasingly challenging to locate due to the historical and modern ore mining which has masked or destructed older mining traces.
Up to now, over 80 findspots – including ore deposits, traces of partially fortified settlements, burial mounds and metallurgical smelting spots – have been found and documented. The evidence of metallurgical ability as a result of the examination of the above-mentioned Copper Age settlements shows, at least indirectly, an easily recognisable chain of metallurgical activity, beginning with ore extraction through to the production of the artefacts themselves.
The intensive and systematically-conducted field surveys in the area under study managed for the first time to document and reconstruct traces of mining independent of their respective chronologies. The initial phase of the survey was based“
[text cuts off mid-sentence at page end — continues on following page, not in this PNG.]
Translation (citation names only): Лещаков/Класнаков = Leshtakov/Klasnakov; Венедиков = Venedikov.
Description
TYPE & PURPOSE
This is a conceptual workflow / methods diagram, not a geological or topographic map. It illustrates the integrated data-collection procedures used for the Medni Rid survey chapter: a cycle in which traditional field work sits at the centre and is informed by five complementary remote-sensing and laboratory strands —
- LiDAR remote sensing
- airborne remote sensing
- map interpretation
- satellite remote sensing
- material analysis
Purpose (from caption): show “procedures for data collection in the Medni Rid area and their surroundings.” The circular blue arrows encode iterative, multi-source survey methodology rather than a one-way pipeline. The page belongs to the chapter on field survey combined with LiDAR laser scanning in the Medni Rid area.
FRAME, LAYOUT, ORIENTATION
- Single grey rectangular panel occupying the upper portion of page 309.
- Hub-and-cycle layout:
- Centre: field photograph labelled “(traditional) field work”, ringed by a bold light-blue circular double-arrow.
- Five satellite thumbnails at the periphery with plain white sans labels:
- Upper left — LiDAR
- Upper right — airborne
- Middle right — map interpretation
- Bottom centre — satellite (USGS)
- Middle left — material analysis
- No north arrow, scale bar, coordinate grid, or map legend — none apply to this methods plate.
- Orientation of content is page-up; embedded map/imagery thumbnails have their own internal orientations not annotated.
SCALE
- No scale applicable at figure level.
- Embedded thumbnails are illustrative crops only; no scale bars are legible on the LiDAR, airborne, satellite, or historical-map insets at the resolution of this page render.
EMBEDDED THUMBNAIL DESCRIPTIONS
(traditional) field work — centre
- Colour photo of a four-person survey team on open grassy ground with a pale track, low scrub, and deciduous trees (sparse foliage).
- Team stands in a loose cluster; one person carries a yellow backpack; clothing is casual field dress (jackets, trousers).
- Conveys on-the-ground pedestrian survey / discussion in the Medni Rid landscape — the methodological hub that the remote and lab methods feed.
LiDAR remote sensing — upper left
- Greyscale hillshade / DSM-style relief image.
- Shows complex ground texture: rounded ridges, elongated hollows, fine mottling consistent with vegetative-filtered or bare-earth LiDAR relief used to pick out mining pits, spoil, tracks, and earthworks beneath or through canopy.
- Directly thematises the chapter title’s LiDAR laser-scanning component.
airborne remote sensing — upper right
- Colour aerial photograph of rolling vegetated terrain.
- Greens and browns of woodland/scrub; pale linear strip and clearings; small bright anthropogenic marks.
- Represents aircraft-acquired optical imagery for landscape and site context.
map interpretation — middle right
- Stacked / overlapping historical cartographic sheets in warm paper tones.
- Visible blue water, green and yellow land tints, black linework, and red rectangular outlines highlighting selected map areas or research boxes.
- Encodes archival/historical map reading (e.g. older topographic or mining maps) as a data strand — complementary to modern remote sensing.
satellite remote sensing — bottom centre
- Greyscale satellite scene with mottled texture (vegetation / relief contrast).
- Small black-and-white USGS logo at lower right of the thumbnail — source cue for the imagery (US Geological Survey Earth-observation products).
- Represents spaceborne optical or similar reconnaissance imagery.
material analysis — middle left
- Colour lab photo: automated or semi-automated pipettor / multi-channel liquid handler over a transparent multi-well plate with tubing or pipette tips engaged.
- Represents geochemical / archaeometric laboratory analysis of collected materials (ores, slags, soils, ceramics, etc.) feeding back into field interpretation.
GRAPHIC / FLOW STRUCTURE
- Two thick curved blue arrows form an open ring around the central photo, together reading as a closed methodological loop.
- Visual message: field work is continuously informed by, and feeds into, LiDAR, airborne imagery, historical map reading, satellite imagery, and lab analysis — multi-proxy data collection rather than a ranked hierarchy.
- Parentheses on “(traditional) field work” gently mark classical survey as continuing alongside modern sensors, not replaced by them.
WHAT THIS FIGURE IS NOT
- Not a location map of Medni Rid (see body-text pointer to fig. 2 for topographic borders).
- Not a geological map, cross-section, geochemical plot, or site plan.
- Does not inventory the “over 80 findspots” mentioned in the text; those are prose results, not plotted here.
SPATIAL / RESEARCH CONTEXT FROM SAME-PAGE TEXT
Although the diagram itself has no geography beyond method icons, the facing body text defines the survey world this workflow serves:
- Study-area borders (referenced to fig. 2): Black Sea coast (east), Gulf of Burgas (north), Diavolska river (south), Rosenska river (west).
- Prior work: Chernykh at Rosen mine (via Dimitrov 2002); Leshtakov excavations at Akladi Cheiri (Leshtakov/Klasnakov 2011).
- Toponym: Medni Rid = Turkish Bakarlaka (Bakırlık) “copper place”; today the name also attaches to the range high point.
- Research problem: prehistoric mining traces on the present surface are hard to isolate because historical and modern mining masked or destroyed them; written sources cover antiquity onward, but prehistory depends on in situ surface traces.
- Inventory to date (prose): over 80 findspots — ore deposits, traces of partially fortified settlements, burial mounds, metallurgical smelting spots; Copper Age settlements imply a chain from ore extraction to artefact production.
- Claim: systematic field surveys first documented/reconstructed mining traces independent of chronology; “initial phase of the survey was based…” (continues off-page — sharp end of this PNG).
These prose points explain why the six-method cycle exists, especially LiDAR + field work for damaged/overprinted mining landscapes.
RELATIONSHIP TO OTHER FIGURES
- Fig. 1 of the Medni Rid field-survey + LiDAR chapter, Krauss et al. 2020 (Tübingen), printed page 309 (filename Tub_p311).
- Same-page text points forward to fig. 2 for the natural topographic border of the study area (that is the geographic overview map companion — likely Tub_p314_Fig3 or related topographic overview in this collection’s checklist).
- Methodologically upstream of catalogue site plates (mines, kilns, fortresses) and of detailed LiDAR/topographic figures later in the same chapter sequence (e.g. Cherni Vrah trench, Kyumyurlaka ore-pit chain).
- Regional geology/ore-field maps earlier in the volume (Rosen / Varli Bryag / Zidarovo Figs. 9–12, regional Fig. 8) supply the mineral-deposit backbone this survey workflow explores on the ground.
Consistency Check
- Not applicable: no UTM centroid and no map-axis coordinates on this methods figure.
Notes
- Filename Tub_p311 vs printed page 309: PDF vs book pagination difference; content identity is this chapter’s Fig. 1 workflow diagram.
- Caption style “Fig 1.” (space, no period after Fig) transcribed as printed.
- Thumbnail internal texts (map labels, instrument LCD strings, full USGS line) are largely too small to read completely on this page render; only clearly legible marks (USGS badge; general lab/pipette scene; four-person field team; hillshade texture; aerial vegetation; historical map colour sheets with red boxes) are asserted. Illegible micro-text is not invented.
- German/English chapter context; method labels all English.
- Circular arrows’ exact clockwise vs bidirectional reading is visual: two arrowheads on a ring imply continuous iterative flow through all nodes via the field-work hub.
- Body text ends mid-sentence (“based”) at page break.
- None further.