Description
Transcription
Page header (top rule line):
- Left: 360
- Centre/right: Petar Leshtakov, Kalin Dimitrov, Jonas Abele, René Kunze, Ernst Pernicka, and Raiko Krauss
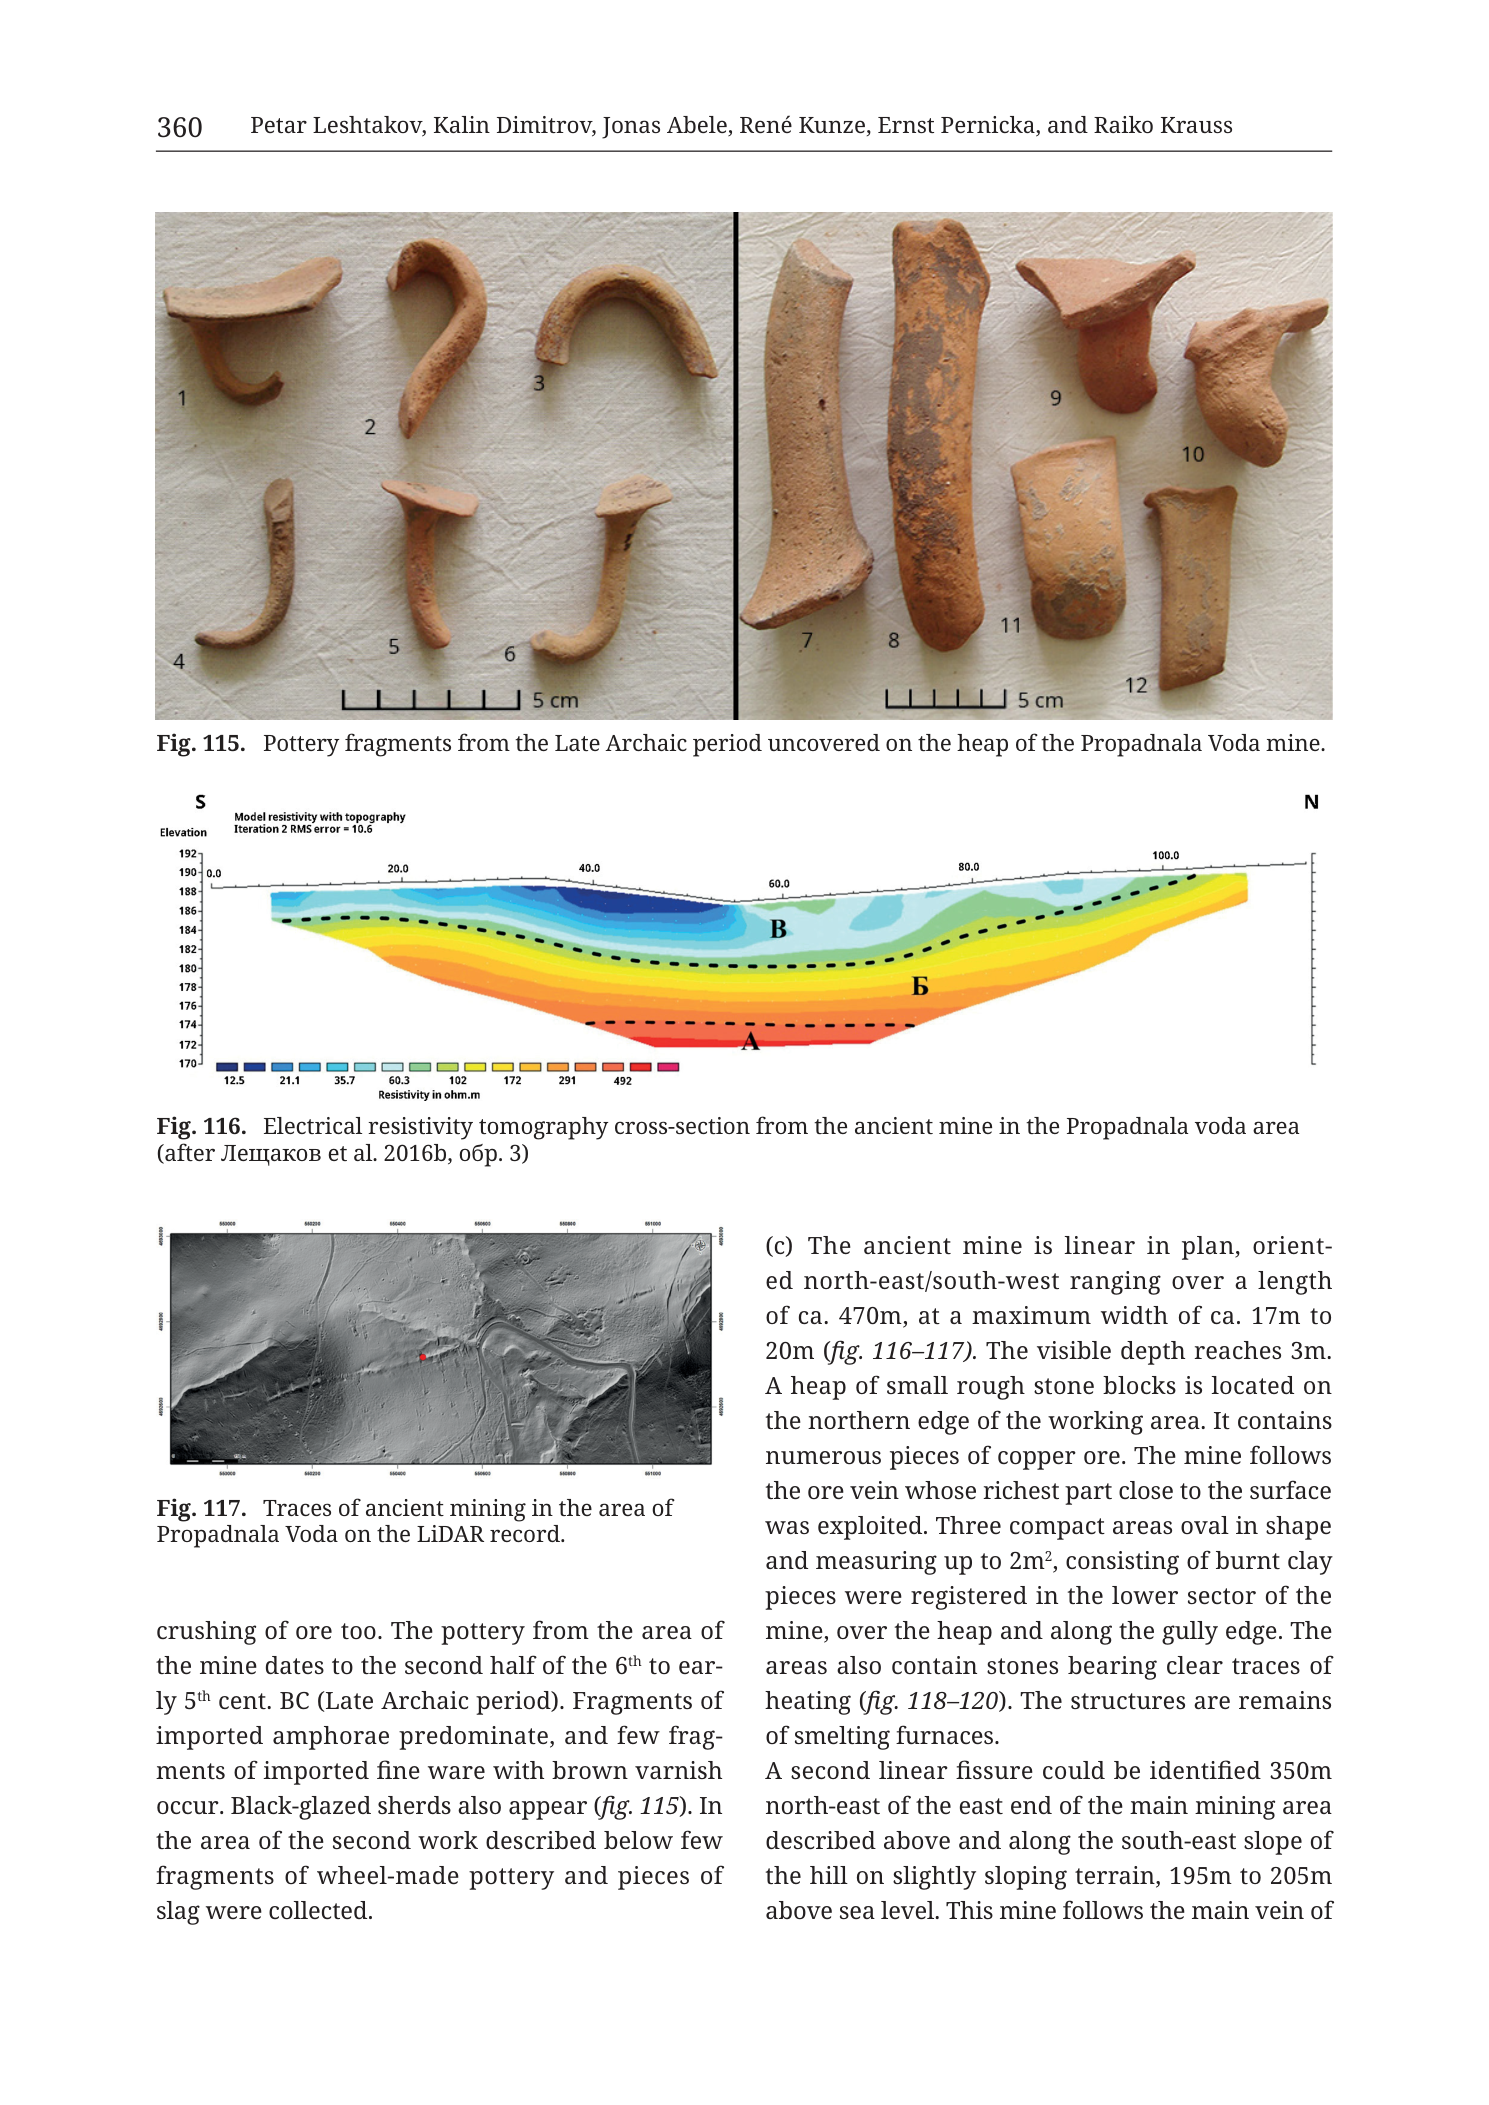
Fig. 115 (top, full width) — pottery finds plate (two side-by-side photo panels)
Caption (below figure): Fig. 115. Pottery fragments from the Late Archaic period uncovered on the heap of the Propadnala Voda mine.
Left sub-panel (objects 1–6 on white cloth background):
- Scale bar bottom-centre: open bar with ticks, labelled 5 cm at right end.
- Numbered objects:
- Curved rim/wall sherd, reddish-brown, open profile (upper left).
- High-swung vertical handle, arched, round/oval section (upper centre-left).
- Broad horizontal handle / handle-stub on wall fragment, curved (upper centre-right).
- Elongate handle fragment, J-shaped / drooping curve (lower left).
- Vertical handle attached to small wall stub, T-/mushroom top as displayed (lower centre).
- Curved handle fragment, thick oval section (lower right of left panel).
Right sub-panel (objects 7–12 on white cloth background):
- Scale bar bottom-centre: open bar with ticks, labelled 5 cm at right end.
- Numbered objects: 7. Long tapering solid ceramic piece / handle or leg fragment, vertical (far left of right panel). 8. Long thick cylindrical/spindle fragment, vertical, lighter accretions on surface (centre-left). 9. Small cup-/bowl-shaped fragment or knob, open hollow (upper right of centre). 10. Thick curved wall/rim fragment (far upper right). 11. Trapezoidal wall sherd, lighter interior surface (lower centre-right). 12. Trapezoidal wall sherd, similar fabric (lower far right).
No fabric/ware labels beyond the caption’s Late Archaic dating. No individual typological names printed on the plate.
Fig. 116 (middle, full width) — electrical resistivity tomography cross-section
Caption (below figure): Fig. 116. Electrical resistivity tomography cross-section from the ancient mine in the Propadnala voda area (after Лещаков et al. 2016b, обр. 3)
Translation (citation): Leshtakov et al. 2016b, fig./obr. 3.
Panel header (top-left inside plot): Model resistivity with topography Iteration 2 RMS error = 10.6
Orientation labels:
- S above the left end of the section.
- N above the right end of the section.
Horizontal axis (distance along profile, metres):
- Tick labels: 0.0 | 20.0 | 40.0 | 60.0 | 80.0 | 100.0
- (Profile length slightly exceeds 100 m at the right end.)
Vertical axis (left; elevation):
- Title: Elevation
- Tick labels (bottom → top): 170 | 172 | 174 | 176 | 178 | 180 | 182 | 184 | 186 | 188 | 190 | 192
- Units: metres (a.s.l., implied by elevation labelling).
Colour scale (bottom of section, left side):
- Title: Resistivity in ohm.m
- Colour bar left → right (low → high resistivity), with numeric labels: 12.5 | 21.1 | 35.7 | 60.3 | 102 | 172 | 291 | 492
- Colours grade approximately: deep blue → blue → cyan → green → yellow → orange → magenta/pink.
In-section annotations:
- Solid black topographic surface line along the top of the coloured model (gently undulating ground surface, slight central depression).
- Two bold dashed black polylines within the model:
- Upper dashed line running roughly sub-parallel to topography across most of the section, labelled B near the centre (above a local resistive high).
- Lower dashed line deeper in the section, more irregular, labelled A near the centre-left trough.
- Cyrillic capital letter Б placed in the mid-right portion of the section within a blue/cyan low-resistivity zone, below and right of label B.
- Rainbow resistivity fill: a continuous layered model from ~surface down to ~170–174 m elevation at the base of the plotted strip; a prominent cool-coloured (blue/cyan = lower resistivity) trough/channel occupies the middle-deep part of the section beneath the central surface depression; warmer colours (yellow–orange–magenta = higher resistivity) form deeper and flanking bodies.
No separate north arrow (section is a vertical plane S→N). No map-inset location of the profile line on this figure.
Fig. 117 (lower left) — LiDAR hillshade plan of mine traces
Caption (below figure): Fig. 117. Traces of ancient mining in the area of Propadnala Voda on the LiDAR record.
Coordinate ticks (UTM metre grid; labels are small on the page render):
- Top edge (west → east): 550000 | 550100 | 550200 | 550300 | 550400 | 550500 | 550600 [labels read as 100 m steps in the 550000 band; outermost values confirmed in the 550000–550600 range]
- Bottom edge: matching easting sequence in the same 550000–550600 band
- Left edge (north → south): 4692800 | 4692700 | 4692600 [100 m steps in the 4692xxx band; exact outermost corner labels partly tight against the frame]
- Right edge: matching northing sequence
North arrow: compass rose present in the upper-right area of the LiDAR frame (N up).
Scale bar (bottom-left inside frame): present; numeric end label on the order of 100 m class (segments visible; exact printed end numeral small).
Map-face annotations:
- Bright/red linear highlight tracing a NE–SW elongated mining hollow / fissure across the centre of the frame (the main ancient working).
- Greyscale hillshade of ridge-and-gully terrain; the highlighted linear depression is the dominant anthropogenic scar; fainter tracks and natural drainage flanks it.
Body text — continuation of entry 36 (from previous page)
[Left column, under Fig. 117 — completes the sentence begun under Fig. 114 on p. 359:]
crushing of ore too. The pottery from the area of the mine dates to the second half of the 6th to ear- ly 5th cent. BC (Late Archaic period). Fragments of imported amphorae predominate, and few frag- ments of imported fine ware with brown varnish occur. Black-glazed sherds also appear (fig. 115). In the area of the second work described below few fragments of wheel-made pottery and pieces of slag were collected.
[Right column, beside Fig. 117:]
(c) The ancient mine is linear in plan, orient- ed north-east/south-west ranging over a length of ca. 470m, at a maximum width of ca. 17m to 20m (fig. 116–117). The visible depth reaches 3m. A heap of small rough stone blocks is located on the northern edge of the working area. It contains numerous pieces of copper ore. The mine follows the ore vein whose richest part close to the surface was exploited. Three compact areas oval in shape and measuring up to 2m², consisting of burnt clay pieces were registered in the lower sector of the mine, over the heap and along the gully edge. The areas also contain stones bearing clear traces of heating (fig. 118–120). The structures are remains of smelting furnaces. A second linear fissure could be identified 350m north-east of the east end of the main mining area described above and along the south-east slope of the hill on slightly sloping terrain, 195m to 205m above sea level. This mine follows the main vein of
[Page ends; entry 36 continues on the following page — figs. 118–120 and remaining fields not in this PNG.]
No legend key beyond the ERT colour bar; no stratigraphic column; no table.
Description
TYPE & PURPOSE
Continuation plate for catalogue entry 36. Mine and Metallurgical Site Propadnala Voda (Krauss et al. 2020). This page supplies:
- Fig. 115 — Late Archaic pottery from the mine heap (typological/chronological evidence).
- Fig. 116 — ERT (electrical resistivity tomography) cross-section through the ancient mine (subsurface geometry of the working / vein zone).
- Fig. 117 — LiDAR plan of the linear surface mining traces.
- Body text completing field (b) chronology/finds and the bulk of field (c) mine morphology, ore heap, smelting-furnace remains, and a second satellite fissure.
Together with the previous page (aerial fig. 113, hammer-stone fig. 114, entry header and field a), this is the core descriptive package for Propadnala Voda as an ancient linear open-work copper mine with associated primary smelting.
OVERALL PAGE LAYOUT
- Portrait monograph page; header page number 360 at left; author line at right.
- Top: full-width Fig. 115 (two photo sub-panels separated by a vertical rule).
- Middle: full-width Fig. 116 ERT section.
- Lower third: Fig. 117 LiDAR (left) + catalogue text column (right), with leftover (b) text also under Fig. 117 at left.
- No separate footer.
Fig. 115 — Late Archaic pottery from the Propadnala Voda mine heap
Type & purpose
Studio finds plate of diagnostic ceramic fragments recovered from the mine’s waste heap, dated by the caption and body text to the Late Archaic (second half of the 6th – early 5th cent. BC).
Organisation
- Two equal photo panels on white cloth, each with its own 5 cm scale bar.
- Twelve individually numbered fragments (1–6 left; 7–12 right).
Object-by-object morphological notes
Left panel — mostly handles and rim/handle joins (transport/storage amphora repertoire):
- Open curved rim/upper-wall sherd — reddish fabric, simple rounded lip.
- High vertical strap/rod handle with strong arch — classic amphora handle morphology.
- Horizontal or sharply curved handle attached to wall — thick oval section.
- Long curved handle fragment (lower attachment zone), J-profile.
- Vertical handle with flaring upper attachment / rim stub.
- Thick curved handle fragment, heavy oval section.
Right panel — handles, body sherds, and one small open form: 7. Long tapering solid piece (handle or support fragment). 8. Long thick cylindrical fragment with surface concretions/accretions. 9. Small open cup- or bowl-like fragment / hollow knob. 10. Thick curved wall or rim fragment. 11–12. Two trapezoidal body sherds of similar fabric and wall thickness.
Chronological / functional reading (from text + plate)
- Body text: imported amphorae predominate; few imported fine wares with brown varnish; black-glazed sherds also present — all assigned to Late Archaic.
- The plate’s handle-heavy selection supports the amphora-dominated assemblage (transport jars on a mining/smelting site — supply containers rather than a domestic table set).
- Fine-ware / black-glaze pieces mentioned in text are not individually called out by number on the plate; several plainer wall sherds (11–12) and the small open form (9) may relate to that minority component, but the figure itself does not label ware classes per object.
Scale
- Each sub-panel: 5 cm scale bar. Larger handles are on the order of 8–15 cm in preserved length; body sherds several centimetres across.
Fig. 116 — ERT cross-section, Propadnala Voda ancient mine
Type & purpose
2D electrical resistivity tomography model (with topography) across the ancient mine, reproduced after Leshtakov et al. 2016b, obr. 3. Purpose: image the subsurface expression of the mined vein/working beneath the surface fissure.
Trace & orientation
- Vertical section oriented S (left) → N (right).
- Horizontal length slightly over 100 m (ticks at 0, 20, 40, 60, 80, 100 m).
- No map shows the profile’s ground trace on this page; coupling with Fig. 117’s linear NE–SW mine implies the ERT line is a local cross-cut of that working (body text cites figs. 116–117 together for the linear mine’s dimensions).
Axes & processing
- Elevation 170–192 m a.s.l. (22 m vertical window).
- Surface topography gently undulates, with a shallow central depression near ~50–70 m chainage.
- Inversion metadata: “Iteration 2 RMS error = 10.6”.
- Resistivity colour scale 12.5–492 ohm·m (log-like labelled steps).
Model geometry (observed)
- A cool-coloured (low-resistivity, blue–cyan) elongate body occupies the middle depth of the section, thickening under the central surface depression and extending as a sub-horizontal to gently arched zone — the feature most plausibly associated with the disrupted/worked ground, clay-rich fill, or moisture-bearing fracture zone of the mine.
- Warmer (higher-resistivity, yellow–orange–magenta) material forms the deeper base and some flanking/upper pockets — more resistive host rock or drier compact ground.
- Near-surface skin is generally intermediate to cool tones following topography.
Annotated horizons / bodies
- Dashed line A — deeper irregular dashed boundary in the lower central model; marks a deeper interface beneath the main cool zone.
- Dashed line B — shallower dashed boundary sub-parallel to topography, labelled near a local resistive feature in the upper-middle section.
- Cyrillic Б — additional labelled zone in the mid-right cool body (likely a body/unit identifier carried over from the 2016b source figure; not re-keyed in English on this reproduction).
Relationship to mine morphology (text)
- Visible surface depth of the mine reaches 3 m; the ERT window images far deeper (down to ~170 m elevation against surface ~188–190 m, i.e. on the order of ~15–20 m below surface in the centre), so the section is imaging the broader vein/alteration structure and not only the open cut.
- Body text: mine follows the ore vein whose richest near-surface part was exploited — the central low-resistivity trough under the surface depression is the geometric candidate for that worked corridor in this model (interpretive; the figure itself does not print an “ore vein” label).
Vertical exaggeration
- Horizontal ~100 m vs vertical window 22 m plotted across a wide shallow panel — moderate vertical exaggeration is present (the section is drawn much wider than tall relative to a 1:1 true-scale strip). True dips of contacts would be steeper in unexaggerated view than they appear.
Fig. 117 — LiDAR traces of ancient mining at Propadnala Voda
Type & purpose
LiDAR hillshade plan highlighting the linear surface expression of the main ancient mining fissure/working at Propadnala Voda.
Frame, extent, orientation
- Wide rectangular greyscale LiDAR panel with UTM tick frame, north up.
- Eastings in the 550000–550600 band (100 m label interval); northings in the 4692600–4692800 band (100 m labels).
- Ground extent on the order of ~600 m E–W by ~200–300 m N–S (from the labelled tick span), i.e. a strip long enough to hold the catalogue’s ca. 470 m NE–SW mine length.
Consistency with site-36 centroid
- Site-36 centroid from previous page: 35T 550460 4692717.
- That easting/northing falls inside the 550000–550600 × 4692600–4692800 window → PASS (see Consistency Check below).
Relief & anthropogenic signal
- Dominant feature: a bright linear NE–SW depression (over-drawn or naturally bright in the hillshade) cutting diagonally across the frame — the open-work mining fissure.
- Flanking ground shows gentler natural slope texture; secondary tracks/drainages appear as thinner linear features.
- Matches body text (c): linear plan, NE–SW, length ca. 470 m, max width ca. 17–20 m, visible depth to 3 m.
- A heap of small rough stone with copper ore on the northern edge of the working (text) is not separately symbolised but would sit along the upper (north) shoulder of this linear scar.
Scale
- Graphical scale bar present at bottom-left (100 m class).
- No ratio scale.
Catalogue text — Entry 36 continued (fields b-completion and c)
Completing (b) from previous page:
- Hammer stones also used for ore crushing.
- Pottery from the mine area: second half of the 6th – early 5th cent. BC (Late Archaic).
- Assemblage: imported amphorae predominate; few imported fine wares with brown varnish; black-glazed sherds (fig. 115).
- At the second working (described below): few wheel-made pottery fragments and pieces of slag.
(c) Mine morphology and metallurgical structures:
- Main ancient mine: linear in plan, orientation NE–SW, length ca. 470 m, max width ca. 17–20 m (figs. 116–117).
- Visible depth up to 3 m.
- Northern-edge heap of small rough stone blocks containing numerous pieces of copper ore.
- Mine follows the ore vein; richest near-surface part exploited.
- Three compact oval areas up to 2 m², of burnt clay pieces, in the lower sector of the mine, over the heap, and along the gully edge; stones with clear heating traces (figs. 118–120, not on this page). Interpreted as remains of smelting furnaces.
- Second linear fissure: 350 m NE of the east end of the main mining area; SE slope of the hill; gently sloping terrain; 195–205 m a.s.l.; follows the main vein of … [continues next page].
Consistency Check — Fig. 117 / Site 36
- Centroid (from previous page): 35T 550460 4692717
- Map bounds (from labelled ticks): Easting [~550000–550600], Northing [~4692600–4692800]
- Easting: 550000 ≤ 550460 ≤ 550600 → PASS
- Northing: 4692600 ≤ 4692717 ≤ 4692800 → PASS
- Result: PASS
- Note: outermost tick values are small on the render; the pass holds for the clearly readable 550000-band / 4692xxx-band label set. If a corner tick differs by one 100 m step, the centroid still sits well inside the highlighted mine corridor’s map.
SPATIAL RELATIONSHIPS (page-level)
- Main Propadnala Voda working: NE–SW linear open cut ~470 × 17–20 m, up to 3 m deep, following a near-surface copper vein; ore-bearing stone heap on the north edge; three small burnt-clay smelting-furnace patches in the lower sector / heap / gully edge.
- ERT S–N section images the worked corridor and deeper resistive structure beneath a shallow surface depression along that mine.
- LiDAR plan locates the same linear scar in UTM 35T around easting 550xxx, northing 46927xx — matching centroid 550460 / 4692717.
- Second fissure 350 m NE of the main work’s east end, at 195–205 m a.s.l. on the SE hill slope — a satellite extraction line on the same vein system.
- Chronology of the heap pottery (Late Archaic, late 6th–early 5th c. BC) anchors the mine’s ancient use earlier than the generic “Greek and Roman” labels used for some neighbouring catalogue sites; slag at the second work extends the metallurgical signal beyond the main cut.
- Functional chain on Medni Rid west/east slopes: Propadnala Voda extraction (+ on-site furnace patches) linked to the nearby Karakachanski Kolibi primary smelting scatter ~0.65–0.7 km west (previous plates).
RELATIONSHIP TO OTHER FIGURES
- Fig. 115 ← cited from continuing (b) text on this page; heap pottery.
- Figs. 116–117 ← cited from (c) for linear mine geometry.
- Figs. 118–120 (cited, not shown) ← burnt-clay smelting-furnace areas.
- Prior page figs. 113–114 ← aerial of mine from east; ore-crushing stone tool.
- Source ERT figure: Лещаков et al. 2016b, обр. 3.
- Geological deposit context: Tzankova (2023) Fig. 1 “Propadnala Voda”; other Tub_* Medni Rid plates.
Notes
- Printed page header reads 360; PNG filename uses p362. Same off-by-two filename-vs-print offset as other catalogue plates in this batch. page_hint follows the print.
- Filename suffix
_mine_planfits Fig. 117 (LiDAR plan) and the dimensional (c) text; the page is not exclusively a plan plate — it also carries the pottery plate and ERT section. - Fig. 117 coordinate ticks are small; easting/northing bands are secure (550000s / 4692xxx), and the centroid consistency check passes, but individual outermost corner labels should be re-read from a higher-resolution source if sub-100 m precision is required.
- Fig. 116 label Б is carried from the Bulgarian source figure without an English key on this page; A and B dashed lines likewise lack an on-figure legend explaining whether they are geological contacts, inversion artefacts, or interpreted working floors — treated as labelled interfaces only.
- Caption orthography “Propadnala voda” (lowercase v) retained in transcription of Fig. 116; elsewhere “Propadnala Voda”.
- Entry 36 still incomplete at page end (second fissure sentence cut off; fields d–g and figs. 118–120 absent).
- Vertical exaggeration on the ERT plot is noted qualitatively; no VE ratio is printed.